Institutional Insights: Societe Generale ¨Pricing The Unthinkable After The Precious Metals Collapse¨

Pricing the unthinkable after the precious collapse: Reading extreme moves in options markets – gold to $20,000:oz
Metal meltdown: Metal prices saw a sharp collapse. Gold fell 10% on Friday, marking its largest intraday drop since 2008 and its biggest daily decline since the 1980s. Silver plunged 30%, while copper was less affected, dropping 3.3%. By today, gold is down another 2.3%, silver 3%, and copper 1.4%, hinting at stabilised conditions. Positioning, not fundamentals, drove these moves, with ETF flows and hedge fund activity playing significant roles. Hedge funds cut silver positions to a two-year low, while gold holdings dropped after reaching a record $78 billion two weeks ago.
Price collapse drivers: The Federal Reserve reset expectations, reducing political risk and monetary-debasement premiums in precious metals. Kevin Warsh’s potential Fed Chair nomination signalled lower chaos risks, boosting the US dollar and resetting real-rate expectations. Gold reacted to the “less bad than expected” monetary policy. Violent price drops stemmed from crowded trades, forced liquidations, margin calls, and systematic fund deleveraging, amplified by month-end profit-taking and leverage flushes.
Outlook: Option strike prices with high open interest suggest psychological support/resistance levels and potential price-risk scenarios for gold, silver, copper, and oil. Open interest clusters can increase volatility due to delta hedging. We cannot pinpoint speculative versus hedging positions, but timing analysis and experience provide valuable insights into sentiment and price expectations.
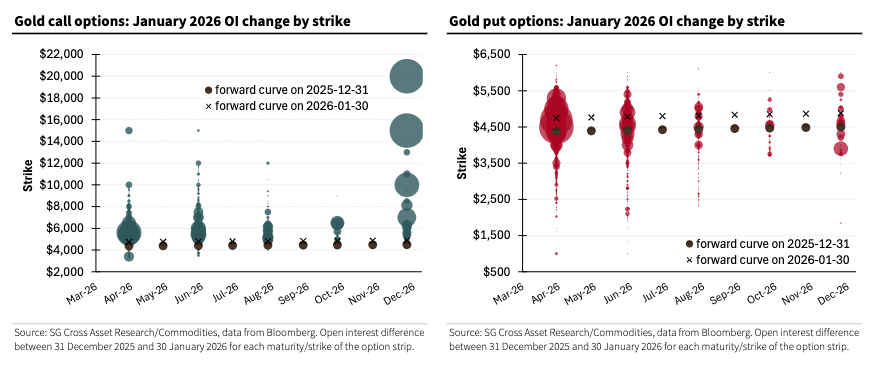
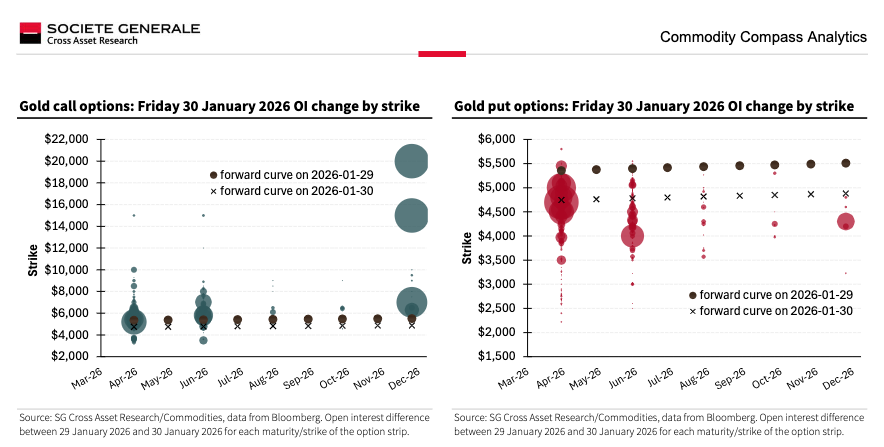
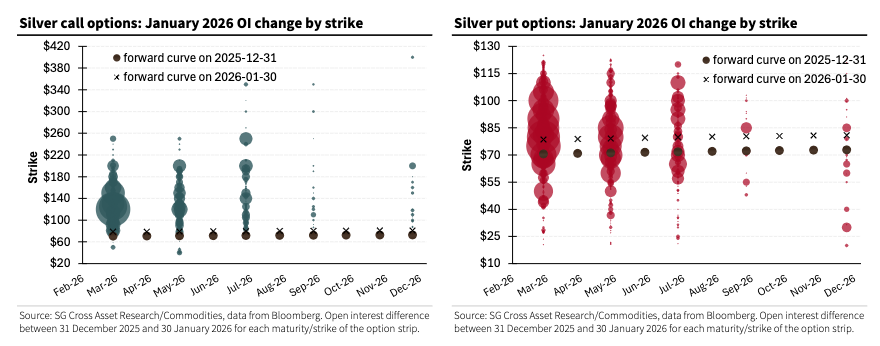
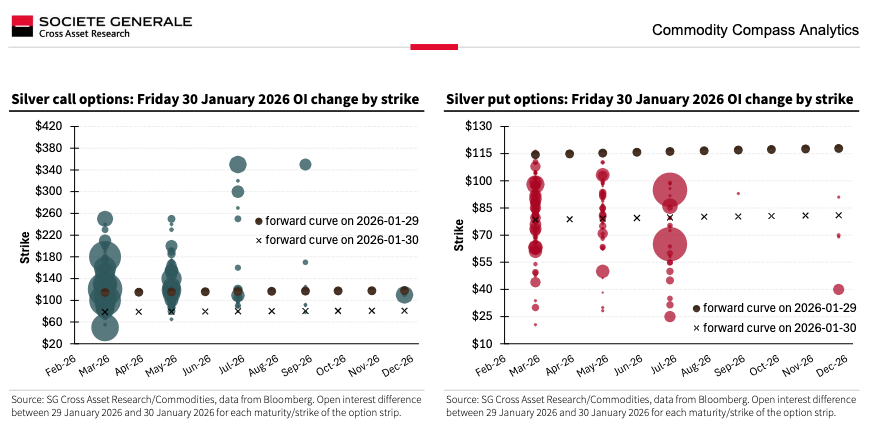
How to read the charts: The charts use bubble sizes to show the most significant changes in open interest by strike and maturity through January 2026 for calls (left) and puts (right). Changes are measured from December 31, 2025, to January 30, 2026, including Friday’s price collapse. Larger bubbles indicate bigger changes. The current forward curve (as of last Friday) and the curve from the last trading day of 2025 are also shown. For gold and silver, charts focus on changes in open interest from last Thursday’s close to Friday’s close.
Key insights: We highlight the largest option open-interest changes for gold and silver
Gold: Despite Friday’s price drop, we remain bullish on gold due to strong fundamentals, even with reduced Fed-related uncertainty. Corrections are seen as healthy. Friday’s data shows significant December 2026 call builds at $10,000/oz, $15,000/oz, and $20,000/oz strikes, indicating strong upside sentiment. Put interest is less extreme, with a notable build at $4,000/oz. Upside bets heavily outweigh downside ones.
Gold option activity rebounded late last week after hitting a 10-year low in open interest. On Friday, traders added twice as many calls as puts (+12k calls vs. +5.5k puts), with the April future being the most active maturity post-February contract expiry. Call flows concentrated in the $5,200–$5,500 range, while puts focused on $4,600–$5,000. Longer-dated bullish positions emerged, including +5k calls for December 2026, with significant builds at $10,000, $15,000, and $20,000 during the price drop.
Silver: Gold on steroids. Silver ETF flows show a higher beta (13.6) to prices than gold (9.2), with silver being ten times less liquid. Last Friday, silver dropped 26%, reflecting gold’s decline and silver’s lower liquidity.
Outlook: Near-term silver options (March expiry) show the largest builds at $120/oz, followed by $125/oz and $150/oz, with $200/oz strikes notable for May and July 2026. On the downside, significant builds are at $75/oz (March), $80/oz, and $90/oz strikes.
Recent Activity: Silver put open interest hit record highs in late January before Tuesday’s expiration, while call interest remained steady. On Friday, 2.6k puts in March were unwound, including a full offset of a 1,300-lot position at $75. In July maturities, the downside builds focus on $65 and $95 strikes, while only 400 calls were added, reflecting caution toward silver’s upside.
Disclaimer: The material provided is for information purposes only and should not be considered as investment advice. The views, information, or opinions expressed in the text belong solely to the author, and not to the author’s employer, organization, committee or other group or individual or company.
Past performance is not indicative of future results.
High Risk Warning: CFDs are complex instruments and come with a high risk of losing money rapidly due to leverage. 71% and 74% of retail investor accounts lose money when trading CFDs with Tickmill UK Ltd and Tickmill Europe Ltd respectively. You should consider whether you understand how CFDs work and whether you can afford to take the high risk of losing your money.
Futures and Options: Trading futures and options on margin carries a high degree of risk and may result in losses exceeding your initial investment. These products are not suitable for all investors. Ensure you fully understand the risks and take appropriate care to manage your risk.
Patrick has been involved in the financial markets for well over a decade as a self-educated professional trader and money manager. Flitting between the roles of market commentator, analyst and mentor, Patrick has improved the technical skills and psychological stance of literally hundreds of traders – coaching them to become savvy market operators!